
22 December 2024
Everyone wants to get rich, the faster the better. Computer science offers a lot of opportunities and maybe also something for this goal. Stocks are a great way to gain more money. So, why just don’t make a bot?
The idea: make a bot which can detect if a stock goes up or goes down. If it the price is increasing, the bot should quickly buy the stock, but if it is going down, the bot must sell the stock. Simple, right?
Let’s write some code, but I will split the code, because otherwise it will be way to long if I show it in once.
First, we import some libraries, not so exciting as the next part. We make a new class with three functions. In the first one, we set the nummer for the amount of cash, next we set a begin date and the finish date. We give ourselves a stock. We also need to determine how far our bot must look back in the time. To make it even better, we write a max and min.
#region imports
from AlgorithmImports import *
#endregion
import numpy as np

class SimpleBreakoutExample(QCAlgorithm):

    def Initialize(self):
        # Set the cash for backtest
        self.SetCash(100000)

        # Start and end dates for backtest
        self.SetStartDate(2017,9,1)
        self.SetEndDate(2020,9,1)

        # Add asset
        self.symbol = self.AddEquity("SPY", Resolution.Daily).Symbol

        # Lookback length for b/o (in days)
        self.lookback = 20

        # Upper/lower limit for lookback length
        self.ceiling, self.floor = 30, 10

        # Price offset for stop order
        self.initialStopRisk = 0.98
        self.trailingStopRisk = 0.9
        # Schedule function 20 minutes after every market open

        self.Schedule.On(self.DateRules.EveryDay(self.symbol), \
                        self.TimeRules.AfterMarketOpen(self.symbol, 20), \
                        Action(self.EveryMarketOpen))
If you like the story so far and you are interested in investing and you want to make money:
In the next functions, we make a plot.
def OnData(self, data):
        # Plot security's price
        self.Plot("Data Chart", self.symbol, self.Securities[self.symbol].Close)
This function is the most interesting one. The lookback length is not one fixed value, it can change. The limit for the lookback length can also be changed. The most important part, buy and sell. Lastly, we plot the results.
def EveryMarketOpen(self):
        # Dynamically determine lookback length based on 30 day volatility change rate
        close = self.History(self.symbol, 31, Resolution.Daily)["close"]
        todayvol = np.std(close[1:31])
        yesterdayvol = np.std(close[0:30])
        deltavol = (todayvol - yesterdayvol) / todayvol
        self.lookback = round(self.lookback * (1 + deltavol))

        # Account for upper/lower limit of lockback length
        if self.lookback > self.ceiling:
            self.lookback = self.ceiling
        elif self.lookback < self.floor:
            self.lookback = self.floor

        # List of daily highs
        self.high = self.History(self.symbol, self.lookback, Resolution.Daily)["high"]

        # Buy in case of breakout
        if not self.Securities[self.symbol].Invested and \
                self.Securities[self.symbol].Close >= max(self.high[:-1]):
            self.SetHoldings(self.symbol, 1)
            self.breakoutlvl = max(self.high[:-1])
            self.highestPrice = self.breakoutlvl

        # Create trailing stop loss if invested
        if self.Securities[self.symbol].Invested:
            # Check if the asset's price is higher than highestPrice & trailing stop price not below initial stop price
            if self.Securities[self.symbol].Close > self.highestPrice and \
                    self.initialStopRisk * self.breakoutlvl < self.Securities[self.symbol].Close * self.trailingStopRisk:
                # Save the new high to highestPrice
                self.highestPrice = self.Securities[self.symbol].Close
                # Update the stop price
                updateFields = UpdateOrderFields()
                updateFields.StopPrice = self.Securities[self.symbol].Close * self.trailingStopRisk
                self.stopMarketTicket.Update(updateFields)

                # Print the new stop price with Debug()
                self.Debug(updateFields.StopPrice)

            # Plot trailing stop's price
            self.Plot("Data Chart", "Stop Price", self.stopMarketTicket.Get(OrderField.StopPrice))
The most complex part is done. Now, let’s take a look at the results.

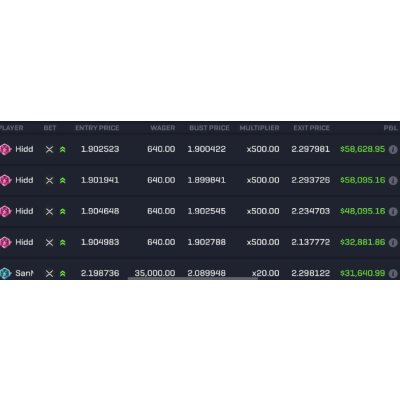
As you can see in the graphic, the stock went up, but also a few times down. This is normal, every stock is dynamic and is always moving. So time to see some more numbers and digits. I will go through the most important results step by step. I start in the upper left corner, by PSR. PSR stands for Probabilistic Sharpe Ratio. It is difficult, so if you want explanation, check this. Next, we have the amount of trades, in this case 9. If you made a loss, so the value of the stock decreased, it was at a average of -1,77%. The average win percentage was way better: 10,39%. There are a few other numbers, but those aren’t the most interesting ones.


The stock market is unpredictable, but these ideas can help you a lot. Make sure to check the site which made this possible. (Link down below)

 BTC
BTC ETH
ETH USDT
USDT USDC
USDC TRX
TRX